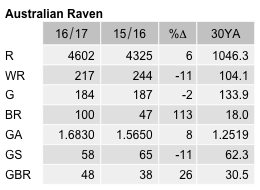
Australian Raven
Corvus coronoides
ABR description
The following is extracted from the Annual Bird Report for the twelve months to June 2017.
Very common, breeding resident
At home in urban and rural sites, calling from high vantage points and scavenging by shops, schools, parks and roads.
General: The reporting rate 33.0% is down 11% on last year and 15% on the 10YA and 14% on the 30YA. Recorded in all seasons with a slight spring peak 27%. Australian Ravens do not usually flock together in large numbers, with the median being 2 and average this year 2.8. There were 7 records in the 20’s and an unusually large 33/10 Jul JWNR (SmA1). The historical database shows this species is typically nest building between Jun & Oct and then a smattering of breeding records through summer and autumn. Another breeding parameter shows dy is typically between Sep and Jan. This ABR fits some of this pattern with nb from Jul to Sept and dy Oct to Dec.
GBS: Recorded in all weeks at most sites. While group sizes are typically 6 or fewer, the max was 26/Feb Pearce (KrS1). Abundance (A=1.6830) is a little higher than last year, 14% up on the 10YA and 34% up on the 30YA. This species starts breeding very early in the season. Earliest breeding for this reporting year was co/1wk Jul Gleneagles GrI16 (PeH2). Breeding activity would have started well before then, and the last dy/2wk Mar Duffy (HaS3).
Abundance
Abundance is the average number of birds of that species per survey. Where the species was observed (presence recorded) but the number of birds seen was not recorded, this is treated as a count of zero.
Abundance by year
This chart shows the abundance of Australian Raven between 1982 and 2017. 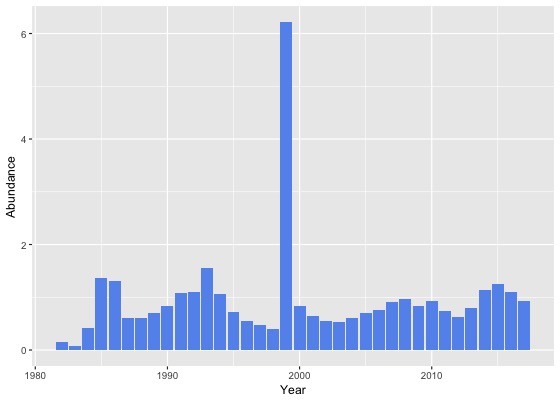
Abundance by month
This chart shows the monthly abundance of Australian Raven. The blue lines show the abundance for the twelve months to June 2017 and the bars show the average abundance for the period 1982 to 2017. 
Abundance by season
This chart shows the seasonal abundance of Australian Raven. The blue lines show the seasonal abundance for the twelve months to June 2017 and the bars show the average seasonal abundance for the period 1982 to 2017. 
Abundance data
| Month | Season | ||||||||||||||||||
|---|---|---|---|---|---|---|---|---|---|---|---|---|---|---|---|---|---|---|---|
| Period | Jul | Aug | Sep | Oct | Nov | Dec | Jan | Feb | Mar | Apr | May | Jun | Winter | Spring | Summer | Autumn | All | ||
| All years | |||||||||||||||||||
| All | 1.0 | 0.9 | 0.8 | 1.0 | 0.8 | 0.8 | 1.9 | 0.9 | 0.9 | 0.9 | 0.9 | 0.9 | 1.0 | 0.9 | 1.2 | 0.9 | 1.0 | ||
| Previous years | |||||||||||||||||||
| All previous years | 1.0 | 0.9 | 0.8 | 1.0 | 0.8 | 0.7 | 2.1 | 0.9 | 0.9 | 0.9 | 0.9 | 0.9 | 0.9 | 0.9 | 1.3 | 0.9 | 1.0 | ||
| Previous 30 years | 1.0 | 0.9 | 0.8 | 1.0 | 0.8 | 0.7 | 2.1 | 0.8 | 0.9 | 0.9 | 0.9 | 0.9 | 0.9 | 0.9 | 1.3 | 0.9 | 1.0 | ||
| Previous 20 years | 1.0 | 1.0 | 0.8 | 1.0 | 0.8 | 0.7 | 2.3 | 0.9 | 0.9 | 0.9 | 0.9 | 1.0 | 1.0 | 0.9 | 1.4 | 0.9 | 1.0 | ||
| 10 year groups | |||||||||||||||||||
| [2007,2017) | 1.2 | 1.1 | 0.9 | 1.2 | 0.9 | 0.9 | 0.8 | 0.9 | 1.0 | 0.9 | 1.1 | 1.1 | 1.1 | 1.0 | 0.8 | 1.0 | 1.0 | ||
| [1997,2007) | 0.7 | 0.6 | 0.6 | 0.7 | 0.5 | 0.5 | 7.5 | 0.7 | 0.7 | 0.8 | 0.7 | 0.7 | 0.7 | 0.6 | 2.7 | 0.7 | 1.1 | ||
| [1987,1997) | 0.9 | 0.8 | 0.9 | 0.7 | 0.7 | 0.7 | 0.7 | 0.7 | 0.9 | 0.9 | 0.9 | 0.8 | 0.8 | 0.7 | 0.7 | 0.9 | 0.8 | ||
| 5 year groups | |||||||||||||||||||
| [2012,2017) | 1.3 | 1.2 | 1.0 | 1.2 | 1.0 | 0.9 | 0.8 | 1.0 | 1.1 | 1.0 | 1.1 | 1.2 | 1.2 | 1.1 | 0.9 | 1.0 | 1.0 | ||
| [2007,2012) | 1.0 | 0.9 | 0.8 | 1.1 | 0.8 | 0.7 | 0.7 | 0.7 | 0.8 | 0.7 | 0.9 | 1.0 | 1.0 | 1.0 | 0.7 | 0.8 | 0.9 | ||
| [2002,2007) | 0.7 | 0.6 | 0.6 | 0.7 | 0.5 | 0.5 | 0.6 | 0.7 | 0.6 | 0.8 | 0.6 | 0.7 | 0.7 | 0.6 | 0.6 | 0.7 | 0.6 | ||
| [1997,2002) | 0.7 | 0.6 | 0.6 | 0.6 | 0.6 | 0.6 | 15.3 | 0.8 | 0.7 | 0.7 | 0.8 | 0.7 | 0.6 | 0.6 | 5.1 | 0.7 | 1.8 | ||
| [1992,1997) | 1.3 | 1.0 | 1.3 | 0.7 | 0.8 | 0.9 | 1.1 | 0.6 | 0.9 | 0.9 | 1.2 | 0.7 | 1.0 | 0.9 | 0.9 | 1.0 | 0.9 | ||
| [1987,1992) | 0.7 | 0.6 | 0.6 | 0.7 | 0.6 | 0.7 | 0.5 | 0.8 | 0.9 | 0.9 | 0.7 | 0.9 | 0.7 | 0.6 | 0.7 | 0.8 | 0.7 | ||
| Year | |||||||||||||||||||
| 2017 | 1.4 | 1.0 | 0.9 | 1.0 | 1.0 | 1.0 | 0.8 | 0.8 | 0.9 | 0.9 | 0.8 | 0.9 | 1.1 | 1.0 | 0.8 | 0.9 | 0.9 | ||
| 2016 | 1.3 | 1.2 | 1.2 | 1.3 | 1.1 | 1.0 | 0.9 | 0.9 | 1.1 | 1.0 | 1.1 | 1.1 | 1.2 | 1.2 | 0.9 | 1.1 | 1.1 | ||
| 2015 | 1.9 | 1.7 | 1.3 | 1.4 | 1.0 | 1.2 | 1.0 | 1.2 | 1.2 | 1.0 | 1.3 | 1.4 | 1.6 | 1.3 | 1.1 | 1.2 | 1.3 | ||
| 2014 | 1.3 | 1.3 | 0.7 | 1.2 | 0.9 | 0.9 | 0.9 | 1.5 | 1.5 | 1.2 | 1.1 | 1.1 | 1.2 | 1.0 | 1.1 | 1.3 | 1.1 | ||
| 2013 | 0.8 | 0.7 | 0.6 | 1.0 | 1.0 | 0.7 | 0.6 | 0.6 | 0.9 | 0.6 | 1.0 | 1.2 | 0.9 | 0.9 | 0.7 | 0.8 | 0.8 | ||
| 2012 | 0.8 | 0.7 | 0.5 | 0.8 | 0.6 | 0.6 | 0.5 | 0.4 | 0.6 | 0.7 | 0.7 | 0.7 | 0.7 | 0.7 | 0.5 | 0.7 | 0.6 | ||
| 2011 | 1.2 | 0.9 | 0.9 | 1.3 | 1.0 | 0.6 | 0.5 | 0.4 | 0.4 | 0.7 | 0.3 | 0.8 | 0.9 | 1.1 | 0.5 | 0.5 | 0.7 | ||
| 2010 | 1.3 | 0.7 | 0.7 | 1.1 | 0.8 | 1.2 | 0.9 | 0.9 | 0.8 | 0.6 | 1.4 | 1.0 | 1.0 | 0.9 | 1.0 | 0.8 | 0.9 | ||
| 2009 | 0.7 | 1.1 | 0.8 | 1.1 | 0.7 | 0.6 | 0.7 | 0.7 | 0.8 | 0.7 | 0.7 | 1.1 | 1.0 | 0.9 | 0.7 | 0.7 | 0.8 | ||
| 2008 | 1.0 | 1.3 | 1.1 | 1.1 | 1.0 | 0.5 | 0.9 | 0.8 | 1.1 | 0.8 | 1.0 | 1.0 | 1.1 | 1.1 | 0.7 | 0.9 | 1.0 | ||
| 2007 | 0.7 | 0.6 | 0.6 | 1.2 | 0.6 | 0.6 | 0.6 | 0.9 | 0.9 | 0.8 | 2.0 | 1.2 | 1.0 | 0.9 | 0.7 | 1.1 | 0.9 | ||
| 2006 | 0.8 | 0.6 | 0.7 | 1.3 | 0.6 | 0.6 | 0.8 | 0.7 | 0.6 | 0.7 | 0.5 | 0.6 | 0.7 | 1.0 | 0.7 | 0.6 | 0.8 | ||
| 2005 | 0.9 | 0.7 | 0.7 | 0.4 | 0.7 | 0.7 | 0.7 | 1.0 | 0.6 | 0.7 | 0.8 | 0.7 | 0.8 | 0.6 | 0.8 | 0.7 | 0.7 | ||
| 2004 | 0.6 | 0.6 | 0.6 | 0.5 | 0.4 | 0.5 | 0.5 | 0.7 | 0.7 | 0.8 | 0.6 | 0.8 | 0.7 | 0.5 | 0.5 | 0.7 | 0.6 | ||
| 2003 | 0.5 | 0.4 | 0.5 | 0.3 | 0.4 | 0.5 | 0.3 | 0.7 | 0.5 | 1.2 | 0.4 | 0.5 | 0.5 | 0.4 | 0.5 | 0.7 | 0.5 | ||
| 2002 | 0.9 | 0.7 | 0.4 | 0.5 | 0.4 | 0.3 | 0.7 | 0.5 | 0.7 | 0.5 | 0.5 | 0.6 | 0.8 | 0.4 | 0.5 | 0.6 | 0.5 | ||
| 2001 | 0.9 | 0.5 | 0.6 | 0.6 | 0.6 | 0.7 | 0.4 | 0.5 | 0.6 | 0.9 | 0.8 | 0.7 | 0.7 | 0.6 | 0.6 | 0.7 | 0.6 | ||
| 2000 | 0.9 | 0.7 | 0.7 | 0.6 | 0.6 | 0.8 | 1.2 | 0.9 | 1.1 | 0.7 | 0.8 | 1.1 | 0.9 | 0.6 | 1.0 | 0.9 | 0.8 | ||
| 1999 | 0.2 | 0.7 | 0.6 | 0.7 | 0.6 | 0.5 | 74.6 | 1.0 | 0.9 | 0.6 | 0.7 | 0.5 | 0.5 | 0.6 | 23.9 | 0.7 | 6.2 | ||
| 1998 | 0.1 | 0.5 | 0.5 | 0.5 | 0.4 | 0.3 | 0.7 | 0.3 | 0.2 | 0.4 | 0.5 | 0.4 | 0.4 | 0.5 | 0.4 | 0.3 | 0.4 | ||
| 1997 | 0.4 | 0.5 | 0.4 | 0.3 | 0.6 | 0.2 | 0.6 | 0.7 | 0.5 | 0.7 | 0.8 | 0.3 | 0.4 | 0.4 | 0.4 | 0.7 | 0.5 | ||
| 1996 | 0.7 | 0.4 | 0.5 | 0.4 | 0.5 | 0.8 | 0.7 | 0.2 | 0.4 | 0.8 | 0.6 | 0.8 | 0.6 | 0.4 | 0.6 | 0.6 | 0.6 | ||
| 1995 | 1.0 | 0.6 | 0.3 | 0.7 | 0.5 | 0.3 | 1.1 | 0.2 | 1.3 | 0.7 | 1.0 | 1.0 | 0.8 | 0.5 | 0.6 | 1.0 | 0.7 | ||
| 1994 | 1.5 | 1.7 | 1.3 | 1.2 | 0.8 | 1.3 | 1.6 | 0.5 | 1.1 | 0.9 | 0.6 | 0.8 | 1.3 | 1.0 | 1.2 | 0.9 | 1.1 | ||
| 1993 | 0.8 | 1.7 | 4.5 | 0.7 | 1.6 | 1.9 | 1.4 | 1.4 | 1.0 | 1.4 | 1.8 | 0.7 | 1.1 | 2.2 | 1.6 | 1.4 | 1.6 | ||
| 1992 | 2.7 | 0.7 | 1.1 | 0.9 | 1.2 | 0.7 | 0.6 | 1.6 | 0.6 | 1.3 | 1.7 | 0.2 | 1.3 | 1.0 | 0.9 | 1.2 | 1.1 | ||
| 1991 | 0.8 | 0.6 | 0.8 | 0.5 | 1.4 | 1.1 | 0.6 | 1.6 | 1.4 | 2.2 | 1.6 | 1.8 | 0.9 | 0.9 | 1.1 | 1.7 | 1.1 | ||
| 1990 | 0.7 | 0.5 | 0.6 | 0.6 | 0.3 | 0.6 | 0.3 | 0.8 | 2.3 | 1.2 | 1.2 | 1.5 | 0.8 | 0.5 | 0.6 | 1.6 | 0.8 | ||
| 1989 | 0.7 | 0.7 | 0.6 | 0.7 | 0.5 | 0.6 | 0.6 | 0.8 | 0.7 | 0.9 | 0.6 | 1.0 | 0.8 | 0.6 | 0.7 | 0.7 | 0.7 | ||
| 1988 | 0.5 | 0.7 | 0.6 | 0.7 | 0.5 | 0.6 | 0.5 | 0.6 | 0.6 | 0.7 | 0.6 | 0.6 | 0.6 | 0.6 | 0.5 | 0.6 | 0.6 | ||
| 1987 | 1.1 | 0.2 | 0.6 | 0.6 | 0.6 | 0.7 | 0.6 | 0.8 | 0.5 | 0.6 | 0.5 | 0.6 | 0.6 | 0.6 | 0.7 | 0.6 | 0.6 | ||
| 1986 | 1.3 | 1.5 | 0.5 | 1.6 | 1.2 | 1.4 | 1.0 | 1.4 | 3.0 | 1.3 | 0.7 | 1.3 | 1.4 | 1.1 | 1.3 | 1.6 | 1.3 | ||
| 1985 | 0.4 | 0.6 | 0.6 | 1.0 | 1.0 | 1.3 | 1.9 | 10.7 | 1.3 | 1.3 | 1.0 | 1.0 | 0.6 | 0.9 | 3.2 | 1.2 | 1.4 | ||
| 1984 | 0.0 | 0.0 | 0.0 | 0.0 | 0.0 | 0.0 | 0.6 | 0.2 | 0.7 | 0.7 | 0.6 | 0.4 | 0.3 | 0.0 | 0.3 | 0.7 | 0.4 | ||
| 1983 | 0.0 | 0.0 | 0.0 | 0.1 | 0.3 | 0.2 | 0.0 | 0.1 | 0.0 | - | 0.0 | 0.0 | 0.0 | 0.1 | 0.1 | 0.0 | 0.1 | ||
| 1982 | - | 0.0 | - | 0.0 | 0.0 | 0.1 | - | 0.0 | - | 0.8 | - | 0.0 | 0.0 | 0.0 | 0.0 | 0.8 | 0.2 | ||
Reporting rates
Reporting rate is the proportion of all surveys in which the species was present.
Reporting rate by year
This chart shows the reporting rate of Australian Raven each year between 1982 and 2017. 
Reporting rate by month
This chart shows the reporting rate by month of Australian Raven. The blue lines show the reporting rate for the twelve months to June 2017 and the bars show the average reporting rate for the period 1982 to 2017. 
Reporting rate by season
This chart shows the seasonal reporting rate of Australian Raven. The blue lines show the seasonal reporting rate for the twelve months to June 2017 and the bars show the average seasonal reporting rate for the period 1982 to 2017. 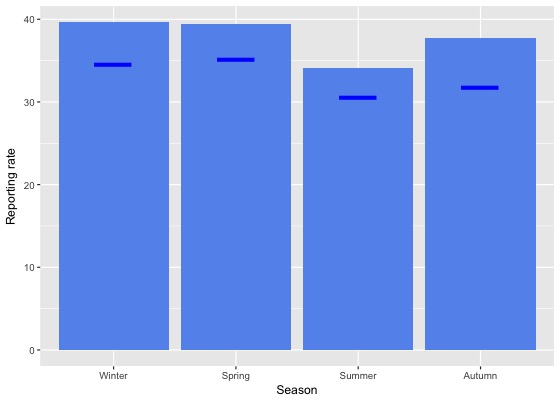
Reporting rate data
| Month | Season | ||||||||||||||||||
|---|---|---|---|---|---|---|---|---|---|---|---|---|---|---|---|---|---|---|---|
| Period | Jul | Aug | Sep | Oct | Nov | Dec | Jan | Feb | Mar | Apr | May | Jun | Winter | Spring | Summer | Autumn | All | ||
| All years | |||||||||||||||||||
| All | 40.7 | 40.2 | 39.9 | 40.9 | 36.8 | 32.8 | 34.3 | 35.3 | 36.7 | 37.8 | 39.0 | 38.5 | 39.6 | 39.5 | 34.1 | 37.7 | 37.7 | ||
| Previous years | |||||||||||||||||||
| All previous years | 41.1 | 41.0 | 40.6 | 41.5 | 37.1 | 33.0 | 35.0 | 36.5 | 37.6 | 38.3 | 41.2 | 39.9 | 40.5 | 40.1 | 34.7 | 38.8 | 38.5 | ||
| Previous 30 years | 41.1 | 41.1 | 40.6 | 41.5 | 36.9 | 33.0 | 35.0 | 36.4 | 37.4 | 38.0 | 41.0 | 40.0 | 40.6 | 40.0 | 34.7 | 38.6 | 38.4 | ||
| Previous 20 years | 39.5 | 39.2 | 39.2 | 40.9 | 35.0 | 31.0 | 34.1 | 35.3 | 36.3 | 36.4 | 39.5 | 39.0 | 39.2 | 38.9 | 33.3 | 37.1 | 37.1 | ||
| 10 year groups | |||||||||||||||||||
| [2007,2017) | 42.1 | 40.5 | 41.1 | 43.1 | 38.0 | 34.7 | 35.6 | 36.5 | 37.9 | 36.6 | 40.3 | 40.9 | 41.1 | 41.3 | 35.6 | 38.0 | 38.9 | ||
| [1997,2007) | 35.0 | 36.5 | 35.4 | 33.4 | 29.0 | 24.1 | 29.0 | 32.2 | 32.9 | 36.0 | 37.7 | 34.9 | 35.4 | 32.9 | 27.7 | 35.1 | 32.7 | ||
| [1987,1997) | 46.7 | 46.6 | 48.0 | 45.0 | 43.0 | 43.9 | 40.1 | 41.4 | 43.8 | 46.2 | 46.7 | 45.3 | 46.2 | 45.1 | 41.8 | 45.5 | 44.7 | ||
| 5 year groups | |||||||||||||||||||
| [2012,2017) | 43.7 | 41.9 | 41.4 | 43.2 | 39.3 | 36.2 | 35.0 | 36.3 | 38.1 | 37.2 | 39.6 | 40.9 | 42.0 | 41.7 | 35.7 | 38.1 | 39.2 | ||
| [2007,2012) | 37.5 | 35.7 | 40.4 | 43.0 | 34.4 | 31.4 | 37.8 | 37.6 | 37.4 | 35.0 | 42.2 | 40.7 | 38.8 | 40.6 | 35.0 | 37.5 | 38.3 | ||
| [2002,2007) | 36.5 | 36.5 | 35.9 | 34.4 | 28.7 | 25.0 | 28.8 | 34.1 | 31.7 | 38.2 | 38.9 | 37.5 | 36.9 | 33.4 | 28.4 | 35.6 | 33.5 | ||
| [1997,2002) | 32.6 | 36.4 | 34.8 | 31.9 | 29.4 | 22.9 | 29.2 | 30.3 | 34.4 | 33.4 | 36.2 | 31.3 | 33.2 | 32.3 | 26.9 | 34.5 | 31.6 | ||
| [1992,1997) | 32.9 | 29.2 | 33.8 | 26.8 | 32.7 | 26.1 | 25.8 | 21.5 | 27.0 | 29.9 | 32.3 | 25.8 | 29.1 | 30.8 | 24.7 | 29.6 | 28.8 | ||
| [1987,1992) | 53.0 | 56.0 | 54.6 | 54.9 | 47.9 | 51.7 | 48.0 | 49.0 | 53.8 | 55.5 | 54.1 | 56.3 | 55.1 | 52.3 | 49.6 | 54.5 | 52.8 | ||
| Year | |||||||||||||||||||
| 2017 | 37.8 | 36.4 | 34.4 | 36.4 | 34.4 | 31.2 | 30.7 | 29.9 | 31.7 | 34.3 | 29.6 | 31.2 | 34.5 | 35.2 | 30.6 | 31.8 | 33.0 | ||
| 2016 | 44.1 | 40.6 | 39.5 | 43.1 | 40.7 | 32.5 | 29.8 | 30.7 | 36.6 | 34.8 | 38.4 | 39.1 | 41.1 | 41.3 | 30.8 | 36.4 | 37.1 | ||
| 2015 | 43.4 | 44.3 | 44.6 | 43.8 | 34.3 | 36.6 | 34.8 | 37.0 | 36.2 | 36.5 | 40.6 | 40.1 | 42.1 | 41.4 | 36.0 | 37.5 | 39.1 | ||
| 2014 | 42.4 | 39.9 | 37.9 | 46.9 | 38.5 | 37.8 | 40.6 | 45.7 | 39.8 | 39.4 | 35.7 | 43.1 | 42.0 | 42.5 | 41.5 | 38.7 | 41.2 | ||
| 2013 | 44.1 | 45.7 | 45.7 | 41.1 | 48.7 | 39.9 | 39.8 | 41.1 | 42.6 | 43.0 | 45.2 | 46.2 | 45.4 | 44.5 | 40.1 | 43.3 | 43.0 | ||
| 2012 | 43.9 | 40.2 | 39.4 | 41.0 | 36.1 | 37.2 | 34.8 | 37.6 | 38.7 | 37.5 | 40.6 | 40.1 | 41.2 | 39.4 | 36.1 | 38.6 | 38.7 | ||
| 2011 | 38.2 | 32.0 | 37.2 | 44.2 | 39.4 | 39.6 | 46.7 | 47.0 | 39.1 | 38.6 | 36.7 | 38.7 | 37.2 | 41.4 | 44.1 | 38.2 | 40.5 | ||
| 2010 | 43.8 | 33.3 | 36.7 | 42.5 | 34.9 | 33.1 | 37.2 | 30.6 | 35.4 | 28.1 | 47.1 | 42.4 | 40.5 | 39.2 | 34.2 | 34.5 | 37.3 | ||
| 2009 | 37.4 | 43.8 | 40.2 | 43.1 | 29.0 | 27.5 | 34.0 | 33.3 | 39.1 | 36.9 | 35.9 | 41.4 | 40.7 | 39.3 | 31.2 | 37.5 | 37.7 | ||
| 2008 | 39.3 | 43.5 | 47.6 | 42.6 | 37.6 | 27.9 | 38.9 | 27.8 | 39.8 | 32.3 | 36.9 | 41.1 | 41.1 | 43.2 | 30.9 | 35.4 | 38.7 | ||
| 2007 | 27.5 | 26.9 | 40.2 | 42.3 | 33.1 | 25.8 | 28.0 | 38.3 | 34.0 | 38.9 | 61.8 | 40.7 | 35.4 | 40.1 | 28.8 | 41.7 | 36.6 | ||
| 2006 | 38.8 | 39.8 | 39.6 | 43.0 | 29.2 | 22.9 | 34.8 | 37.8 | 32.6 | 37.1 | 39.1 | 38.3 | 38.8 | 39.1 | 31.3 | 35.2 | 36.4 | ||
| 2005 | 31.6 | 26.2 | 33.1 | 20.4 | 29.7 | 23.9 | 27.0 | 27.2 | 34.2 | 42.1 | 42.8 | 41.6 | 35.6 | 28.4 | 25.4 | 39.3 | 32.5 | ||
| 2004 | 34.9 | 46.7 | 35.1 | 34.9 | 27.3 | 23.5 | 23.6 | 23.2 | 32.1 | 35.7 | 35.0 | 37.4 | 38.8 | 32.6 | 23.5 | 34.1 | 32.5 | ||
| 2003 | 33.3 | 28.8 | 36.0 | 31.1 | 28.9 | 27.1 | 25.9 | 46.7 | 27.8 | 43.3 | 34.1 | 29.8 | 30.5 | 32.1 | 33.3 | 35.1 | 32.9 | ||
| 2002 | 42.9 | 39.0 | 36.3 | 33.5 | 28.5 | 26.5 | 31.4 | 27.0 | 31.4 | 31.5 | 41.2 | 37.1 | 39.7 | 32.8 | 27.8 | 33.2 | 32.9 | ||
| 2001 | 40.0 | 39.2 | 37.4 | 38.7 | 35.8 | 34.4 | 29.0 | 32.5 | 30.4 | 41.0 | 39.9 | 35.0 | 38.0 | 37.4 | 32.2 | 35.8 | 35.9 | ||
| 2000 | 34.9 | 44.4 | 40.5 | 34.8 | 32.9 | 18.7 | 28.1 | 30.0 | 40.0 | 33.6 | 25.5 | 34.9 | 38.1 | 36.0 | 24.9 | 34.8 | 32.7 | ||
| 1999 | 32.4 | 27.8 | 35.6 | 32.1 | 31.2 | 27.5 | 35.8 | 35.0 | 46.5 | 32.0 | 40.3 | 31.8 | 30.7 | 33.1 | 32.5 | 39.5 | 34.4 | ||
| 1998 | 16.2 | 34.0 | 30.1 | 16.3 | 19.5 | 11.3 | 25.0 | 17.0 | 16.1 | 30.8 | 33.3 | 22.7 | 24.8 | 22.6 | 16.7 | 22.6 | 21.5 | ||
| 1997 | 17.2 | 24.1 | 20.0 | 21.1 | 20.5 | 8.7 | 23.5 | 24.6 | 20.0 | 22.0 | 33.3 | 19.4 | 19.8 | 20.5 | 16.5 | 24.2 | 20.2 | ||
| 1996 | 28.4 | 16.0 | 24.0 | 19.3 | 22.2 | 21.2 | 20.4 | 18.8 | 18.6 | 26.6 | 31.0 | 29.9 | 24.2 | 21.5 | 20.2 | 24.1 | 22.3 | ||
| 1995 | 29.0 | 23.3 | 14.6 | 19.5 | 16.4 | 14.9 | 27.4 | 15.9 | 32.7 | 25.8 | 28.6 | 30.9 | 27.2 | 17.2 | 20.5 | 28.8 | 23.2 | ||
| 1994 | 33.3 | 42.9 | 61.8 | 45.3 | 41.2 | 32.6 | 29.4 | 22.4 | 26.1 | 26.7 | 21.2 | 25.8 | 33.6 | 47.2 | 27.9 | 25.1 | 34.0 | ||
| 1993 | 26.5 | 46.2 | 50.0 | 30.7 | 42.4 | 50.0 | 26.5 | 37.5 | 27.2 | 41.7 | 32.5 | 24.6 | 33.7 | 40.4 | 37.8 | 33.0 | 36.0 | ||
| 1992 | 47.7 | 22.2 | 31.8 | 28.7 | 48.6 | 27.0 | 27.6 | 22.0 | 32.4 | 37.3 | 48.7 | 13.3 | 28.5 | 35.5 | 25.9 | 39.8 | 33.1 | ||
| 1991 | 24.4 | 23.4 | 26.7 | 21.4 | 34.0 | 17.6 | 21.4 | 40.0 | 41.3 | 54.2 | 47.5 | 52.0 | 29.2 | 27.3 | 25.0 | 47.5 | 31.4 | ||
| 1990 | 57.4 | 48.6 | 38.7 | 31.6 | 34.6 | 47.2 | 30.6 | 32.4 | 38.6 | 34.5 | 35.6 | 43.4 | 51.0 | 34.9 | 36.7 | 36.3 | 41.2 | ||
| 1989 | 66.3 | 65.1 | 61.6 | 63.1 | 55.6 | 54.3 | 56.9 | 52.1 | 55.6 | 62.6 | 55.3 | 61.9 | 64.6 | 60.4 | 54.4 | 58.1 | 59.4 | ||
| 1988 | 54.3 | 65.7 | 66.3 | 64.5 | 50.9 | 56.9 | 48.2 | 54.9 | 61.9 | 64.2 | 61.6 | 59.9 | 60.3 | 59.5 | 53.3 | 62.5 | 59.0 | ||
| 1987 | 54.5 | 40.0 | 55.5 | 59.4 | 49.0 | 57.3 | 53.3 | 49.2 | 54.5 | 50.6 | 54.6 | 53.9 | 53.0 | 54.1 | 53.1 | 53.2 | 53.4 | ||
| 1986 | 73.1 | 73.7 | 52.8 | 55.6 | 76.6 | 58.8 | 60.9 | 72.2 | 77.4 | 80.4 | 72.4 | 57.1 | 67.7 | 61.8 | 64.5 | 77.5 | 67.7 | ||
| 1985 | 23.3 | 26.7 | 32.7 | 46.5 | 45.6 | 36.7 | 50.0 | 70.6 | 45.5 | 68.4 | 70.0 | 50.0 | 33.0 | 42.6 | 44.7 | 62.5 | 42.9 | ||
| 1984 | 0.0 | 0.0 | 0.0 | 0.0 | 0.0 | 0.0 | 27.6 | 9.1 | 48.1 | 41.2 | 41.9 | 14.7 | 10.2 | 0.0 | 14.9 | 43.5 | 23.7 | ||
| 1983 | 0.0 | 0.0 | 0.0 | 7.7 | 33.3 | 15.4 | 0.0 | 9.1 | 0.0 | - | 0.0 | 0.0 | 0.0 | 14.8 | 10.0 | 0.0 | 7.0 | ||
| 1982 | - | 0.0 | - | 0.0 | 0.0 | 7.1 | - | 0.0 | - | 7.7 | - | 0.0 | 0.0 | 0.0 | 4.0 | 7.7 | 2.8 | ||
Breeding data
Breeding records by month
Number of breeding records by breeding code and month, 2017 and all years| Breeding code | Jul | Aug | Sep | Oct | Nov | Dec | Jan | Feb | Mar | Apr | May | Jun |
|---|---|---|---|---|---|---|---|---|---|---|---|---|
| 2017 | ||||||||||||
| Breeding (BLA code) | 0 | 1 | 0 | 0 | 0 | 0 | 0 | 0 | 0 | 0 | 0 | 0 |
| Carrying Food | 0 | 1 | 1 | 1 | 1 | 0 | 0 | 0 | 0 | 0 | 0 | 0 |
| Copulating | 0 | 0 | 0 | 0 | 0 | 0 | 0 | 0 | 0 | 0 | 0 | 0 |
| Display | 0 | 0 | 0 | 0 | 0 | 0 | 0 | 0 | 0 | 0 | 0 | 0 |
| Dependent young | 0 | 0 | 1 | 18 | 20 | 8 | 6 | 1 | 0 | 0 | 0 | 0 |
| Faecal sac | 0 | 0 | 0 | 0 | 0 | 0 | 0 | 0 | 0 | 0 | 0 | 0 |
| Inspecting hollow | 0 | 0 | 0 | 0 | 0 | 0 | 0 | 0 | 0 | 1 | 0 | 0 |
| Nest building | 5 | 7 | 0 | 2 | 1 | 0 | 0 | 1 | 0 | 0 | 0 | 1 |
| Nest with eggs | 0 | 0 | 0 | 0 | 0 | 0 | 0 | 0 | 0 | 0 | 0 | 0 |
| Nest with young | 0 | 1 | 0 | 4 | 1 | 0 | 0 | 0 | 0 | 0 | 0 | 0 |
| On/leaving nest | 1 | 2 | 9 | 4 | 0 | 0 | 1 | 0 | 0 | 0 | 0 | 0 |
| All years | ||||||||||||
| Breeding (BLA code) | 3 | 3 | 4 | 7 | 1 | 1 | 2 | 0 | 0 | 0 | 0 | 1 |
| Carrying Food | 0 | 3 | 1 | 18 | 7 | 1 | 0 | 1 | 0 | 0 | 0 | 1 |
| Copulating | 0 | 0 | 0 | 0 | 0 | 0 | 0 | 0 | 0 | 0 | 0 | 0 |
| Display | 0 | 0 | 0 | 0 | 0 | 0 | 0 | 0 | 0 | 0 | 0 | 0 |
| Dependent young | 0 | 1 | 12 | 101 | 60 | 35 | 24 | 3 | 0 | 0 | 0 | 0 |
| Faecal sac | 0 | 0 | 0 | 0 | 0 | 0 | 0 | 0 | 0 | 0 | 0 | 0 |
| Inspecting hollow | 0 | 0 | 0 | 0 | 1 | 0 | 0 | 0 | 0 | 1 | 0 | 0 |
| Nest building | 34 | 24 | 25 | 26 | 4 | 1 | 1 | 2 | 0 | 1 | 0 | 14 |
| Nest with eggs | 0 | 5 | 4 | 0 | 0 | 0 | 0 | 0 | 0 | 0 | 0 | 0 |
| Nest with young | 1 | 4 | 24 | 27 | 12 | 1 | 0 | 0 | 0 | 0 | 0 | 0 |
| On/leaving nest | 8 | 23 | 52 | 43 | 9 | 2 | 2 | 0 | 0 | 0 | 0 | 0 |
Breeding records by year
Average number of breeding records per period by breeding code| Period | Breeding (BLA code) | Carrying Food | Copulating | Display | Dependent young | Faecal sac | Inspecting hollow | Nest building | Nest with eggs | Nest with young | On/leaving nest |
|---|---|---|---|---|---|---|---|---|---|---|---|
| All years | |||||||||||
| All | 0.6 | 0.9 | 0.0 | 0.0 | 6.6 | 0.0 | 0.1 | 3.7 | 0.2 | 1.9 | 3.9 |
| Previous years | |||||||||||
| All previous years | 0.6 | 0.8 | 0.0 | 0.0 | 5.2 | 0.0 | 0.0 | 3.3 | 0.3 | 1.8 | 3.5 |
| Previous 30 years | 0.7 | 0.9 | 0.0 | 0.0 | 6.1 | 0.0 | 0.0 | 3.8 | 0.3 | 2.1 | 4.0 |
| Previous 20 years | 1.1 | 1.1 | 0.0 | 0.0 | 7.1 | 0.0 | 0.0 | 3.5 | 0.0 | 1.9 | 5.4 |
| 10 year groups | |||||||||||
| [2007,2017) | 1.7 | 1.7 | 0.0 | 0.0 | 12.0 | 0.0 | 0.1 | 5.6 | 0.0 | 2.7 | 8.6 |
| [1997,2007) | 0.4 | 0.4 | 0.0 | 0.0 | 2.2 | 0.0 | 0.0 | 1.4 | 0.0 | 1.2 | 2.2 |
| [1987,1997) | 0.0 | 0.7 | 0.0 | 0.0 | 4.0 | 0.0 | 0.0 | 4.5 | 0.9 | 2.4 | 1.3 |
| 5 year groups | |||||||||||
| [2012,2017) | 2.8 | 2.2 | 0.0 | 0.0 | 15.4 | 0.0 | 0.2 | 6.4 | 0.0 | 3.0 | 7.8 |
| [2007,2012) | 0.6 | 1.2 | 0.0 | 0.0 | 8.6 | 0.0 | 0.0 | 4.8 | 0.0 | 2.4 | 9.4 |
| [2002,2007) | 0.0 | 0.8 | 0.0 | 0.0 | 3.0 | 0.0 | 0.0 | 2.0 | 0.0 | 2.0 | 3.6 |
| [1997,2002) | 0.8 | 0.0 | 0.0 | 0.0 | 1.4 | 0.0 | 0.0 | 0.8 | 0.0 | 0.4 | 0.8 |
| [1992,1997) | 0.0 | 0.2 | 0.0 | 0.0 | 0.8 | 0.0 | 0.0 | 1.6 | 0.0 | 0.4 | 2.2 |
| [1987,1992) | 0.0 | 1.2 | 0.0 | 0.0 | 7.2 | 0.0 | 0.0 | 7.4 | 1.8 | 4.4 | 0.4 |
| Year | |||||||||||
| 2017 | 1.0 | 4.0 | 0.0 | 0.0 | 54.0 | 0.0 | 1.0 | 17.0 | 0.0 | 6.0 | 17.0 |
| 2016 | 0.0 | 3.0 | 0.0 | 0.0 | 15.0 | 0.0 | 1.0 | 6.0 | 0.0 | 8.0 | 14.0 |
| 2015 | 0.0 | 1.0 | 0.0 | 0.0 | 23.0 | 0.0 | 0.0 | 13.0 | 0.0 | 2.0 | 7.0 |
| 2014 | 2.0 | 2.0 | 0.0 | 0.0 | 17.0 | 0.0 | 0.0 | 3.0 | 0.0 | 4.0 | 5.0 |
| 2013 | 1.0 | 4.0 | 0.0 | 0.0 | 15.0 | 0.0 | 0.0 | 5.0 | 0.0 | 0.0 | 7.0 |
| 2012 | 11.0 | 1.0 | 0.0 | 0.0 | 7.0 | 0.0 | 0.0 | 5.0 | 0.0 | 1.0 | 6.0 |
| 2011 | 1.0 | 2.0 | 0.0 | 0.0 | 6.0 | 0.0 | 0.0 | 3.0 | 0.0 | 1.0 | 9.0 |
| 2010 | 0.0 | 1.0 | 0.0 | 0.0 | 10.0 | 0.0 | 0.0 | 7.0 | 0.0 | 2.0 | 9.0 |
| 2009 | 0.0 | 0.0 | 0.0 | 0.0 | 12.0 | 0.0 | 0.0 | 4.0 | 0.0 | 1.0 | 8.0 |
| 2008 | 0.0 | 2.0 | 0.0 | 0.0 | 9.0 | 0.0 | 0.0 | 8.0 | 0.0 | 6.0 | 17.0 |
| 2007 | 2.0 | 1.0 | 0.0 | 0.0 | 6.0 | 0.0 | 0.0 | 2.0 | 0.0 | 2.0 | 4.0 |
| 2006 | 0.0 | 2.0 | 0.0 | 0.0 | 7.0 | 0.0 | 0.0 | 4.0 | 0.0 | 4.0 | 9.0 |
| 2005 | 0.0 | 2.0 | 0.0 | 0.0 | 4.0 | 0.0 | 0.0 | 4.0 | 0.0 | 3.0 | 5.0 |
| 2004 | 0.0 | 0.0 | 0.0 | 0.0 | 2.0 | 0.0 | 0.0 | 0.0 | 0.0 | 1.0 | 3.0 |
| 2003 | 0.0 | 0.0 | 0.0 | 0.0 | 1.0 | 0.0 | 0.0 | 0.0 | 0.0 | 2.0 | 1.0 |
| 2002 | 0.0 | 0.0 | 0.0 | 0.0 | 1.0 | 0.0 | 0.0 | 2.0 | 0.0 | 0.0 | 0.0 |
| 2001 | 1.0 | 0.0 | 0.0 | 0.0 | 3.0 | 0.0 | 0.0 | 2.0 | 0.0 | 0.0 | 2.0 |
| 2000 | 2.0 | 0.0 | 0.0 | 0.0 | 1.0 | 0.0 | 0.0 | 0.0 | 0.0 | 0.0 | 0.0 |
| 1999 | 1.0 | 0.0 | 0.0 | 0.0 | 3.0 | 0.0 | 0.0 | 0.0 | 0.0 | 0.0 | 0.0 |
| 1998 | 0.0 | 0.0 | 0.0 | 0.0 | 0.0 | 0.0 | 0.0 | 2.0 | 0.0 | 0.0 | 0.0 |
| 1997 | 0.0 | 0.0 | 0.0 | 0.0 | 0.0 | 0.0 | 0.0 | 0.0 | 0.0 | 2.0 | 2.0 |
| 1996 | 0.0 | 0.0 | 0.0 | 0.0 | 1.0 | 0.0 | 0.0 | 1.0 | 0.0 | 1.0 | 2.0 |
| 1995 | 0.0 | 0.0 | 0.0 | 0.0 | 1.0 | 0.0 | 0.0 | 2.0 | 0.0 | 0.0 | 3.0 |
| 1994 | 0.0 | 0.0 | 0.0 | 0.0 | 0.0 | 0.0 | 0.0 | 1.0 | 0.0 | 1.0 | 3.0 |
| 1993 | 0.0 | 0.0 | 0.0 | 0.0 | 1.0 | 0.0 | 0.0 | 1.0 | 0.0 | 0.0 | 2.0 |
| 1992 | 0.0 | 1.0 | 0.0 | 0.0 | 1.0 | 0.0 | 0.0 | 3.0 | 0.0 | 0.0 | 1.0 |
| 1991 | 0.0 | 0.0 | 0.0 | 0.0 | 2.0 | 0.0 | 0.0 | 1.0 | 0.0 | 0.0 | 2.0 |
| 1990 | 0.0 | 1.0 | 0.0 | 0.0 | 6.0 | 0.0 | 0.0 | 5.0 | 1.0 | 3.0 | 0.0 |
| 1989 | 0.0 | 3.0 | 0.0 | 0.0 | 10.0 | 0.0 | 0.0 | 14.0 | 1.0 | 5.0 | 0.0 |
| 1988 | 0.0 | 0.0 | 0.0 | 0.0 | 9.0 | 0.0 | 0.0 | 9.0 | 4.0 | 8.0 | 0.0 |
| 1987 | 0.0 | 2.0 | 0.0 | 0.0 | 9.0 | 0.0 | 0.0 | 8.0 | 3.0 | 6.0 | 0.0 |
| 1986 | 0.0 | 0.0 | 0.0 | 0.0 | 0.0 | 0.0 | 0.0 | 0.0 | 0.0 | 0.0 | 1.0 |
| 1985 | 0.0 | 0.0 | 0.0 | 0.0 | 0.0 | 0.0 | 0.0 | 0.0 | 0.0 | 0.0 | 0.0 |
| 1984 | 0.0 | 0.0 | 0.0 | 0.0 | 0.0 | 0.0 | 0.0 | 0.0 | 0.0 | 0.0 | 0.0 |
| 1983 | 0.0 | 0.0 | 0.0 | 0.0 | 0.0 | 0.0 | 0.0 | 0.0 | 0.0 | 0.0 | 0.0 |
| 1982 | 0.0 | 0.0 | 0.0 | 0.0 | 0.0 | 0.0 | 0.0 | 0.0 | 0.0 | 0.0 | 0.0 |
Distribution map
Distribution - 2017
This map shows the observed distribution of the Australian Raven for 2017.
The red circles are the grid cells where Australian Raven have been reported.
The transparency of the red circles indicate how many surveys sheets were submitted for that grid cell; the darker the red the more reliable the data. Of the 315 grid cells with reports, 83 had only one sheet; an example is grid number A9.
The size of the circle represents the reporting rate. The maximum reporting rate for Australian Raven was 100.0% (eg grid number A9) and the minimum was 5.3% (eg grid number U3). 
Distribution - all years
This map shows the observed distribution of the Australian Raven for all years.
The red circles are the grid cells where Australian Raven have been reported.
The transparency of the red circles indicate how many surveys sheets were submitted for that grid cell; the darker the red the more reliable the data. Of the 703 grid cells with reports, 55 had only one sheet; an example is grid number B2.
The size of the circle represents the reporting rate. The maximum reporting rate for Australian Raven was 100.0% (eg grid number B2) and the minimum was 3.6% (eg grid number Q29). 
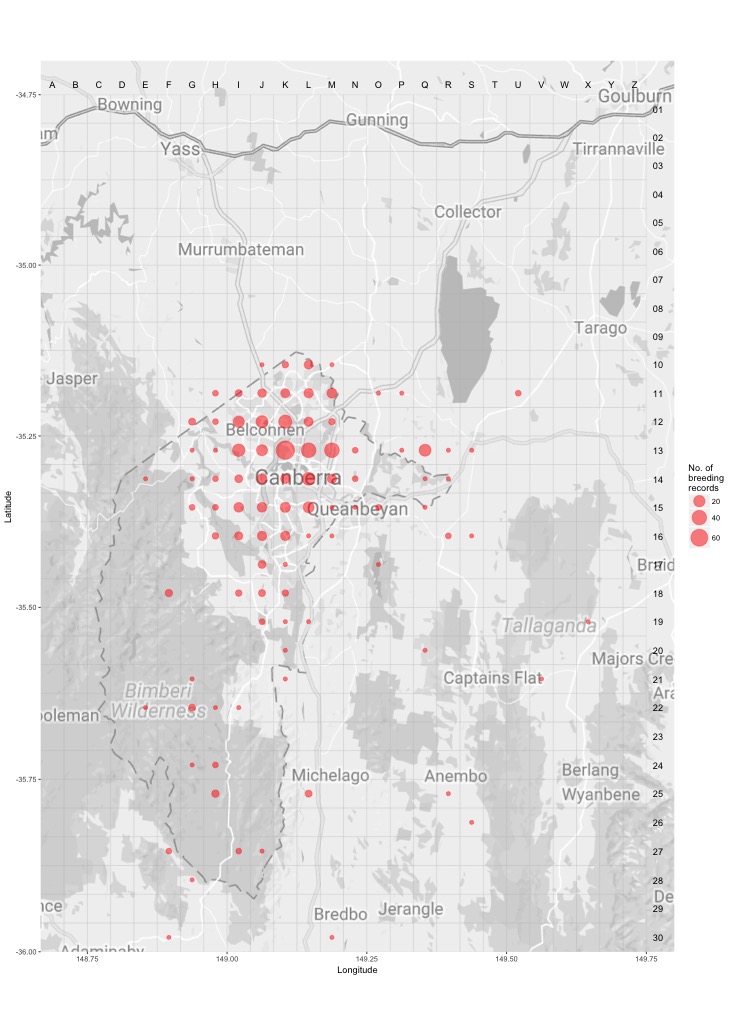
Breeding map
Breeding - 2017
This map shows the breeding distribution of the Australian Raven for 2017.
The red circles are the grid cells where breeding activity for Australian Raven have been reported.
The size of the circle represents the number of reports. 
Breeding - all years
This map shows the breeding distribution of the Australian Raven for all years.
The red circles are the grid cells where breeding activity for Australian Raven have been reported.
The size of the circle represents the number of reports.